Gemini 3.8 Flash: The Stable Model That Beat Its Own Preview
Posted on October 16, 2026
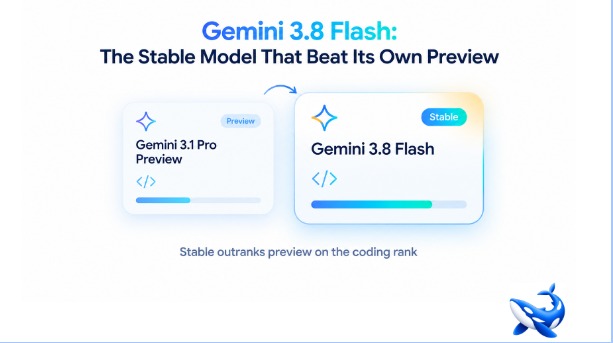
Should a preview model go to production? Most teams answer without thinking: preview stays out until the label changes, because a model with a preview suffix is a moving target. But the question gets harder when a preview outranks its vendor’s own stable flagship on one axis — and sharper still when the stable sibling answers back. That is the situation laid out on OrcaRouter‘s llm model comparison page, where Gemini 3.1 Pro Preview and Gemini 3.8 Flash sit two rows apart with opposite fates: the preview more expensive and slower, while the stable sibling pulls ahead on the independent coding rank, on price, and in real traffic.
The two rows are a case study in what preview status should mean to a rollout plan.
The two previews, opposite fates
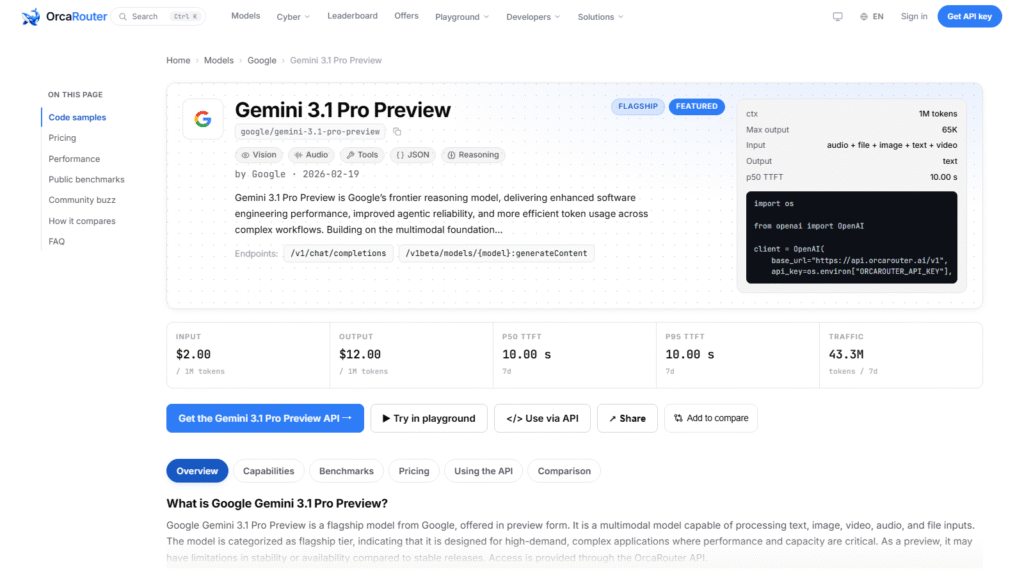
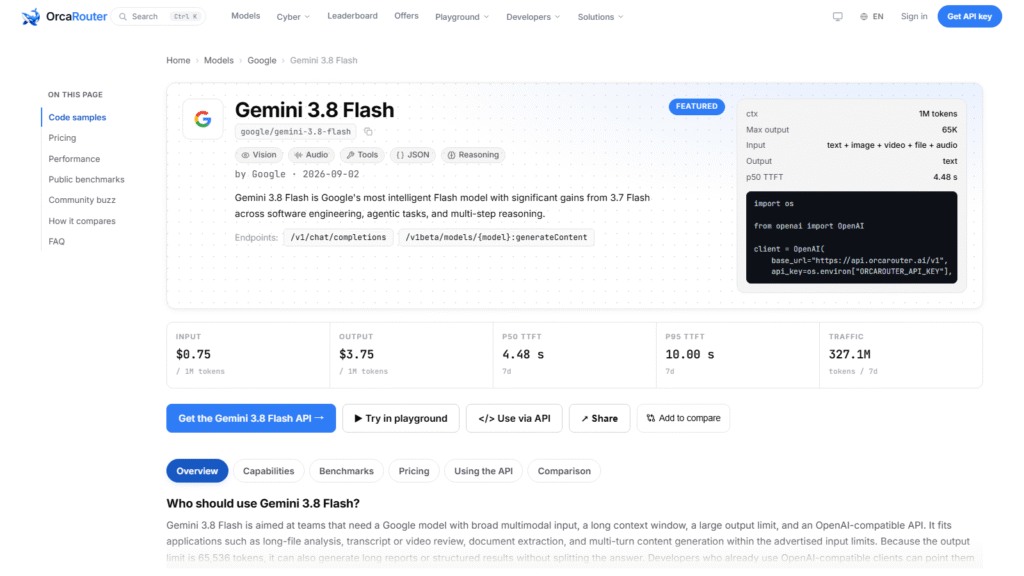
Gemini 3.1 Pro Preview carries the flagship name inside its own family. On an independent benchmark aggregator it records a coding rank of 68.8, placed 30th out of 138 models tested, and an intelligence score of 29.7, placed 58th out of 147. Its stable sibling, Gemini 3.8 Flash, records a coding rank of 76.3, placed 8th out of 138 — a wide margin ahead — and an intelligence score of 40.9, placed 26th out of 147. Same aggregator, same task set, and the cheaper stable model beats the preview on both axes.
Price tells the same story. The preview lists at $2 per million input tokens and $12 per million output tokens, a 6.0x output multiplier; the flash model lists at $0.75 and $3.75, a 5.0x multiplier. The stable row is cheaper on every unit of work. Seven-day token volume on our side is 42.8M for the preview against 335.5M for the flash — roughly eight times as much production traffic, which is the market’s own verdict, read 2026-10-12 and rolling.
The axis where the preview still leads
The preview is not without an ace. Our 0–10 composite quality score — a rating we assign ourselves across quality dimensions such as instruction adherence, reasoning quality, output coherence and consistency — gives the preview a 10.0 and the flash model a 9.0. On our own composite axis, the preview does outrank its stable sibling; both rows share a 1M context window. The latency column runs the other way: the preview sits at the 10.00 s ceiling for time to first token on our production telemetry, while the flash model measures 4.34 s. So the preview is slower and pricier, and the one axis where it still leads the family is our composite quality rating.
That is what makes the two fates opposite rather than merely different. A rollout plan built on the composite column alone would have chosen the preview; a plan built on the independent ranks, on price, or on production traffic would have chosen the stable sibling. The same twelve-row table would have sent the same team in two directions, depending on which column it trusted first.
Two directions from one table
The tension is real, and it is not resolved by picking a favorite column. The composite quality score is our own judgment across quality dimensions, so a team that trusts its own evaluation most will rate the preview ahead; the independent aggregator, the price card and the production telemetry all point the other way. A rollout plan that tries to honor both signals ends up with a two-phase answer: stable in production, preview watched in staging, and the switch made when the measurements — not the label — justify it.
Notice also what does not separate the two rows. Context does not: both carry 1M. Latency does, but in the wrong direction for the preview. Reputation does: the stable sibling has been running real workloads, and real workloads leave a seven-day token trail that the preview cannot match. When the only column favoring a preview is our composite quality score, the label is doing less work than the score.
The deeper lesson is about what a column is allowed to tell you. An independent aggregator reads both models on the same task set, which makes its two rows directly comparable; our composite quality score is deliberately judgment-based, which makes it a statement about our own priorities rather than a statement about the world. Neither figure is wrong, and a rollout plan does not need them to agree. It needs a decision rule in advance for which evidence wins when they do not — otherwise the quiet habit of preferring the flagship name decides for you.
Preview status in a rollout plan
The disciplined answer to the opening question is that preview status is one more data point, not a veto and not an endorsement. A preview row earns a place in the shortlist exactly like a stable row, with three extra checks before it goes anywhere near production: whether the label means the weights can still change; whether a stable sibling already covers the same niche; and whether the numbers you are planning against are stable enough to plan against. Every latency and volume figure on the page is a rolling seven-day window, read on 2026-10-12, so it drifts — and a preview row drifts more than most, because its final form may not be its launch form.
In this pair, the checks settle quickly. The stable sibling is cheaper on input and output, faster on first token, stronger on the independent coding rank, and carries roughly eight times the seven-day traffic. Whatever the composite says, the plan that puts the stable model into production first and keeps the preview in a staging account is the one that matches the evidence. The preview is not disqualified by its label; it is outranked by its own sibling on almost every axis a rollout actually cares about.
That conclusion should also feel uncomfortable for anyone who was raised on the old rule that the biggest number in the family name is the safest default. The premium card here is the one with the preview suffix, and the budget card is the one doing the real work. Families invert. Product generations invert. The only durable habit is reading the current rows each time you plan, with the read date attached, instead of assuming the tier order you remember from last year is still the tier order on the page.
The takeaway
A preview model is neither automatically dangerous nor automatically precious, and the two rows on the table show why you have to look at each one. Gemini 3.1 Pro Preview scores a 10.0 on our composite across quality dimensions, yet trails Gemini 3.8 Flash on the independent coding rank, on price, on latency, and in seven-day token volume. Let the stable row carry production; let the preview earn its way in with measurements.
Before you ship anything, run your own workload against both rows and re-read the numbers, because they move. On read 2026-10-12 the gap is wide and the direction is clear — but a comparison table is a snapshot, and a snapshot alone is the wrong foundation for a production decision.
Sourcing note: 所有数字 read 2026-10-12。Prices, context windows, latency readings and seven-day token volumes come from the OrcaRouter comparison page and the linked model pages; the composite quality scores are our own, assigned across quality dimensions; the coding and intelligence ranks come from an independent benchmark aggregator, with 138 and 147 models in its two leaderboards. Latency and volume figures are rolling windows and drift. All checked 2026-10-12.